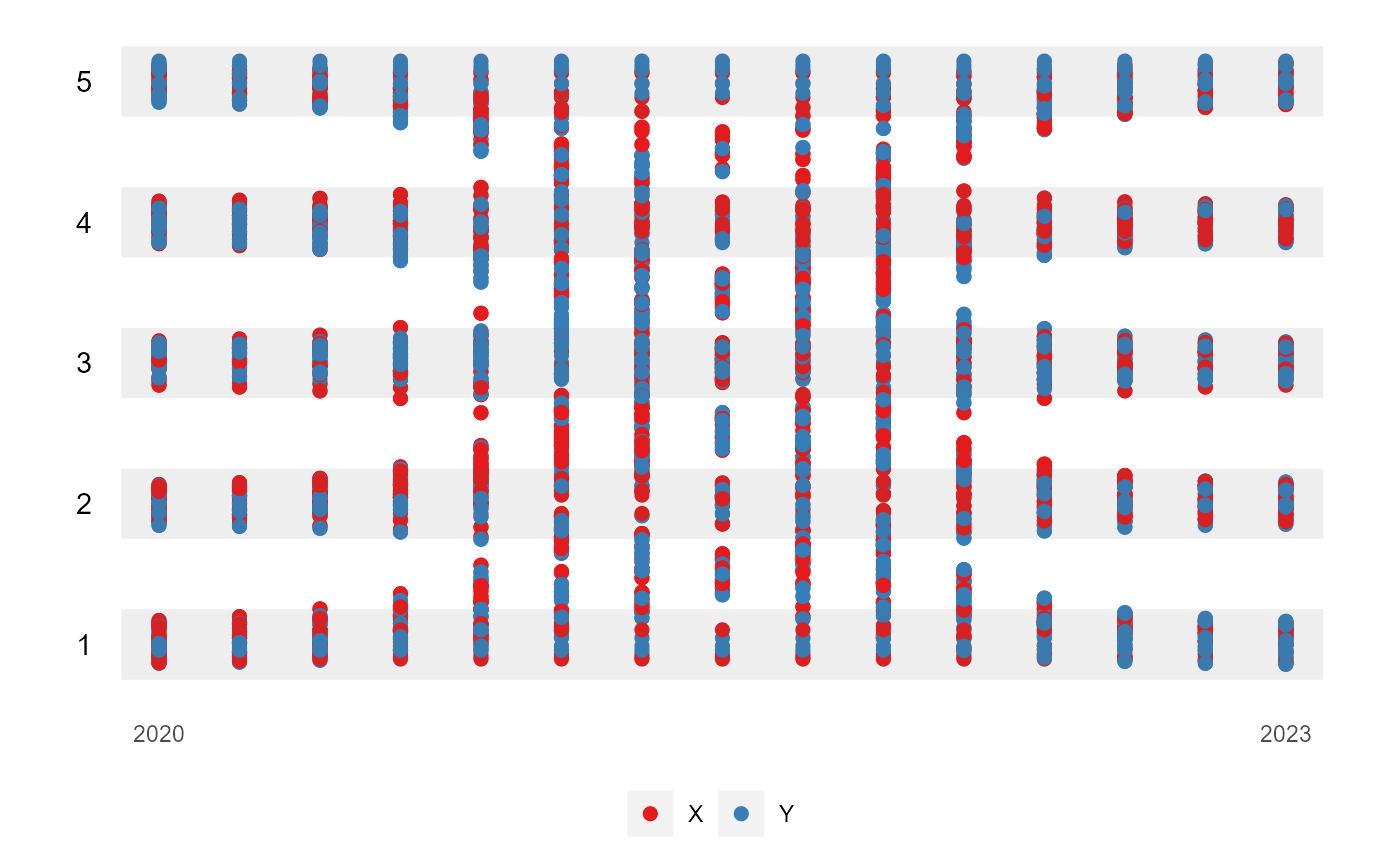
Turn the data into a ggplot object for the animate function
Source:R/kangaroo-plot.R
kangaroo_plot.RdThis function takes in the data which has been prepared by the anim_prep()
or anim_prep_cat() and return the ggplot object. The user can still modify
the plot as usual.
Usage
kangaroo_plot(
  data,
  group_palette = NULL,
  shade_palette = NULL,
  rendering = "gganimate",
  time_dependent = FALSE,
  ...
)
Arguments
- data
The categorized data.
- group_palette
The vector of the palette used by the function to supply the color of each group.
- shade_palette
The vector of the palette used by the function to supply the color to the shaded area.
- rendering
The choice of method used to create and display the plot, either gganimate or plotly.
- time_dependent
Logical. Should the visualization be time-dependent? The default is FALSE.
- ...
Additional arguments for customization. See details for more information.
Details
This function takes categorized data and generates a ggplot object. The kangaroo plot is the plot that shows the movement between groups over time. The point position and point size in the shaded area can be controlled using additional arguments such as height, width, and size. For the shading area, the alpha argument can be used.
Examples
example <- anim_prep(data = dbl_change, id = id, values = values,
time = time, group = gp)

kangaroo_plot(example)
#> You can now use the animbook::anim_animate() function to
#>           transform it into an animated object
